 How to create Indicators & Automated Strategies using TradingView PineScript
PineScript is a simple, free-to-use programming language specifically designed for traders and integrated into the TradingView platform.
A few words about TradingView
TradingView is an online platform that is essentially free and offers all the charting tools and indicators needed to develop trading ideas and share them with the community. The platform features its own scripting language called PineScript—similar to Python—which enables users to create custom indicators. All you need to access TradingView and PineScript is a free account.
» Visit TradingView and open a free account
Introduction to PineScript
PineScript is a cloud-based language, meaning you can create and use indicators on your desktop computer or mobile device without installing any software.
Key Features of Pine Scripts
A script can be either a STUDY or a STRATEGY (see script structures below).
Each script begins with an annotation that defines the version of PineScript used, along with the name and basic properties of the script.
The main body of the script contains FUNCTIONS and VARIABLES. Functions are instructions that perform calculations, while variables store the results of those calculations in the cloud.
PineScript includes built-in functions that can be used in your scripts.
At the end of each script, you can define which variables will be plotted and where they will appear.
Example of a Simple Pine Script
Before moving further, here is a basic Pine script that includes the annotation (Lines 1 and 2), the functions and variables (Lines 3 and 4), and the plotting instruction (Line 5).
You can use this script in your Pine Editor by simply removing the line numbers (1, 2, 3, etc.).
1 //@version=4 {A directive that tells the compiler to use version 4 of PineScript}
2 study("TEST") {States that the structure of the script is a Study (not a Strategy) by giving the name TEST}
3 FunctionA…. {includes the basic calculations of the script}
4 TEST_1 = FunctionA {Links the variable TEST to the calculations of FunctionA}
5 plot(TEST_1, color=color.green) {that will give the instruction to plot the variable TEST_1 on the chart, in green color}
The Two (2) Available Types of Script Structures
As mentioned earlier, a script can be either a Study or a Strategy. Both structures can plot calculations and generate alert events. The key difference is that strategies are designed for trading automation. In other words, strategies allow for the automated placement and modification of trading orders without human intervention.
(1) Study Structures
A study must include at least one function that produces output on the chart (e.g., plot, plotshape, barcolor, etc.).
Example of a PineScript Study Structure
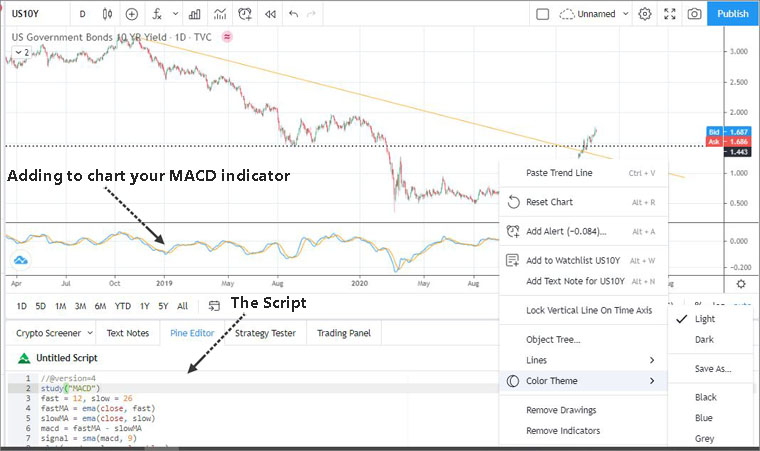
This is a simple MACD study using the standard MACD settings (12, 6, 9):
- Lines 1 and 2 specify the PineScript version and the name of the study.
- Lines 3, 4, and 5 define the functions used in the script.
- Lines 6 and 7 declare the variables and link them to the earlier functions.
- Lines 8 and 9 plot the variables on the screen.
1 //@version=4
2 study("MACD")
3 fast = 12, slow = 26
4 fastMA = ema(close, fast)
5 slowMA = ema(close, slow)
6 macd = fastMA - slowMA
7 signal = sma(macd, 9)
8 plot(macd, color=color.blue)
9 plot(signal, color=color.orange)
Image: MACD study on TradingView

(2) Strategy Structures
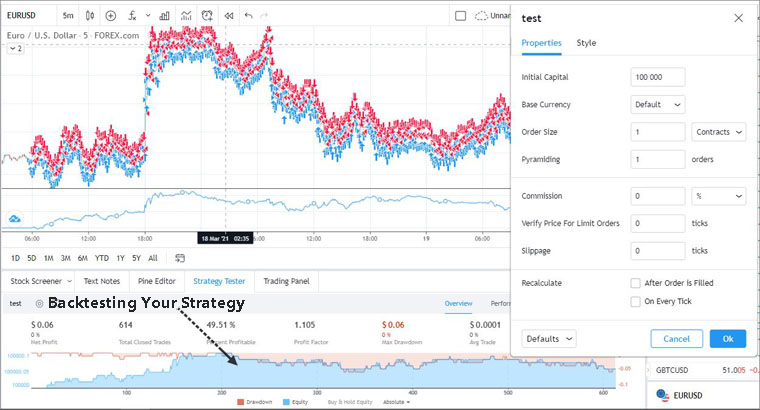
A strategy is a script capable of automatically executing trades, including sending, modifying, and canceling trade orders. Additionally, strategies can backtest any trading idea using historical data. After backtesting a strategy, you can even view hypothetical order fills.
In the example below, you'll find a simple strategy that buys and sells an index. You can use this script in your Pine Editor by simply removing the line numbers (1, 2, 3, etc.).
Example of a simple PineScript strategy
1 //@version=4
2 strategy("test")
3 if bar_index > 5000
4 strategy.entry("buy", strategy.long, 10, when=strategy.position_size <= 0)
5 strategy.entry("sell", strategy.short, 10, when=strategy.position_size > 0)
6 plot(strategy.equity)
Image: Plotting Strategy on TradingView

PineScript Functions & Examples
PineScript contains a plethora of built-in functions, so you don’t have to create everything from scratch.
TIP: How to Uncover all Available Functions, within the Editor
If you are using the Pine editor and you can’t find a certain function you can always get instant help and uncover all available functions by using the following combination of keys.
Type a part of the syntax and then press:
For Windows PCs… CTRL + spacebar
For an Apple Mac… CMD + spacebar
Using ‘Functions’, you can analyze specific markets and even create comparisons between correlated asset classes. For example, suppose you want to create an indicator that plots the price of MicroStrategy to compare it with the price of Bitcoin. In this case, we will create a variable called MSTR and use the simple built-in function called security. This function retrieves data for the MSTR symbol (MicroStrategy) and uses daily (D) closing prices.
□ Example: Indicator showing MicroStrategy price on Data Window
1 //@version=4
2 study("price of MicroStrategy")
3 MSTR_price = security("MSTR", "D", close)
4 plot(MSTR_price)
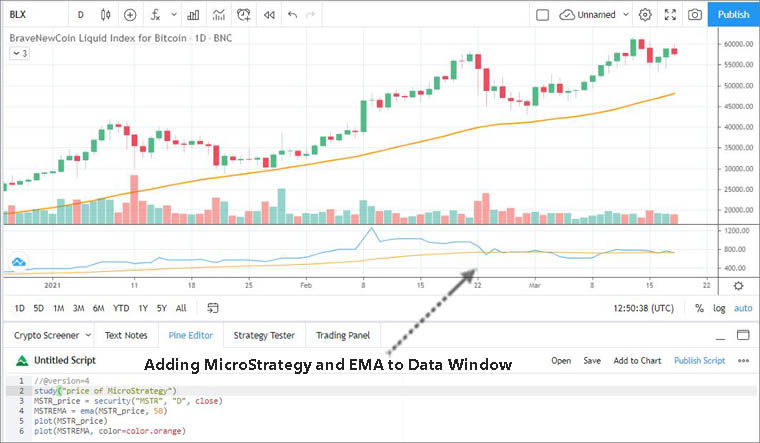
Next, you want to add an EMA to the comparison between Bitcoin and MicroStrategy. Let’s suppose you want to add a 50-period EMA.
You have to add two lines. One line to state the new variable
■ MSTREMA = ema(MSTR_price, 50)
And another line at the end, in order to plot the EMA in orange color.
■ plot(MSTREMA, color=color.orange)
□ Example: Indicator showing MicroStrategy price including a 50-period EMA.
1 //@version=4
2 study("price of MicroStrategy")
3 MSTR_price = security("MSTR", "D", close)
4 MSTREMA = ema(MSTR_price, 50)
5 plot(MSTR_price)
6 plot(MSTREMA, color=color.orange)
Image: MicroStrategy Price & EMA(50) in the Data Window

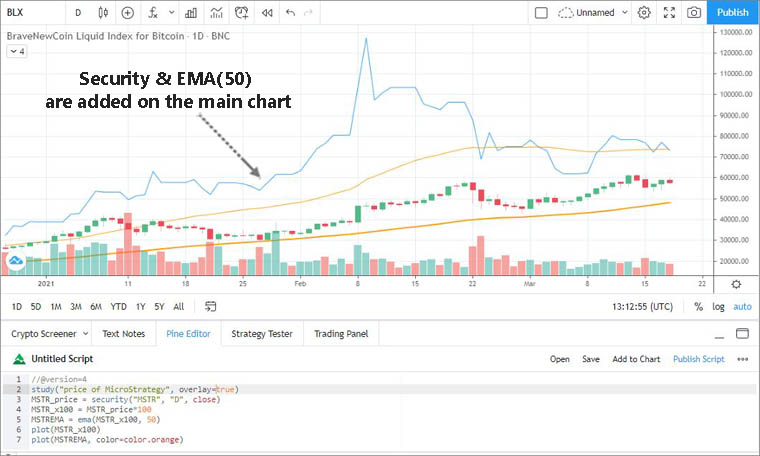
Next, you want to move the MicroStrategy chart and its EMA to the main chart of Bitcoin in order to optimize your comparison. This can be done by adding overlay=true into the study annotation.
■ study("price of MicroStrategy ", overlay=true)
The problem is that MicroStrategy's price is only a fraction of the Bitcoin price, and consequently, the charts are not comparable.
We can easily solve this problem by multiplying the price of MicroStrategy by 100 (X100). This can be done by creating a new variable called MSTR_x100
■ MSTR_x100 = MSTR_price*100
□ Example: Showing MicroStrategy price and a 50-period EMA within the main Bitcoin chart
1 //@version=4
2 study("price of MicroStrategy", overlay=true)
3 MSTR_price = security("MSTR", "D", close)
4 MSTR_x100 = MSTR_price*100
5 MSTREMA = ema(MSTR_x100, 50)
6 plot(MSTR_x100)
7 plot(MSTREMA, color=color.orange)
Image: MicroStrategy Price & EMA(50) in the Main Bitcoin Chart

Creating Visual Alerts
Both types of scripts (studies and strategies) can generate visual alerts.
Example of Creating an Alert Based on RSI(14)
In the following example, we create two RSI-based visual alerts:
-
If RSI crosses above 30, a green arrow appears.
-
If RSI crosses below 70, a red arrow appears.
Here is the script. To use it in your Pine Editor, remember to remove the line numbers (1, 2, 3, etc.) at the beginning of each line.
1 //@version=4
2 study("RSI-ALERTS")
3 r = rsi(close, 14)
4 RSIUp = crossover(r, 30)
5 RSIDn = crossunder(r, 70)
6 plot(r, color=color.black)
7 hline(80, color=color.gray, linestyle=hline.style_dashed)
8 hline(20, color=color.gray, linestyle=hline.style_dashed)
9 plotchar(RSIUp, "BUY", "▲", location.bottom,color.green, size = size.tiny)
10 plotchar(RSIDn, "SELL", "▼", location.top, color.red, size = size.tiny)
11 alertcondition(RSIUp, "Long Alert", "BUY")
12 alertcondition(RSIDn, "Short Alert", "SELL")
Final Thoughts – Why Use PineScript?
The TradingView platform and its programming language, PineScript, are both free. Here are some strong reasons to consider using them:
-
Everything is cloud-based, allowing you to access your account from any device (desktop or mobile) without installing software.
-
TradingView provides access to a wide range of markets and financial assets, including stocks, indices, Forex, bonds, commodities, and cryptocurrencies.
-
You get full access to a rich set of charting tools, chart types, and timeframes.
-
You can create custom indicators or fully automated trading strategies using PineScript.
-
PineScript is easy to learn and comes with an extensive built-in function library.
-
TradingView users can publish their ideas and indicators to the public library.
-
Users also have the option to sell their indicators and strategies to the community through social trading features.
» Visit TradingView and open a free account | » PineScript Coding Tutorial
■ Create PineScript Indicators & Strategies (TradingView)
Giorgos Protonotarios, financial analyst,
ForexAutomatic.com (c)
Resources:
TradingView: https://www.tradingview.com/pine-script-docs/en/v4/Introduction.html
![]() READ MORE ON FOREX AUTOMATIC
READ MORE ON FOREX AUTOMATIC


