 INDICATOR: RSI PRECISION+ (FREE ON TRADINGVIEW)
The RSI Precision+ is an enhanced version of the free “RSI Precision” indicator available on TradingView. This new indicator combines essential trading signals with those provided by RSI Precision. It includes three categories of built-in trading signals.
- RSI Crossovers/Crossunders (▲▼)
- MACD Crossovers (•)
- SMA Death/Golden Crosses (x)
Introduction to RSI PRECISION+
The new indicator “RSI PRECISION” is an alternative to the popular oscillator, the Relative Strength Index (RSI). It combines RSI readings with price momentum to provide more precise signals on longer timeframes. Additionally, it includes a range of built-in trading signals. RSI Precision is especially useful for analyzing volatile assets like technology stocks and cryptocurrencies, where the classic RSI often lacks accuracy on longer timeframes.
■ RSI PRECISION+: Use it here for free on TradingView:
» https://www.tradingview.com/script/kBpWBCXU-RSI-PRECISION-MACD-SMA-Signals/
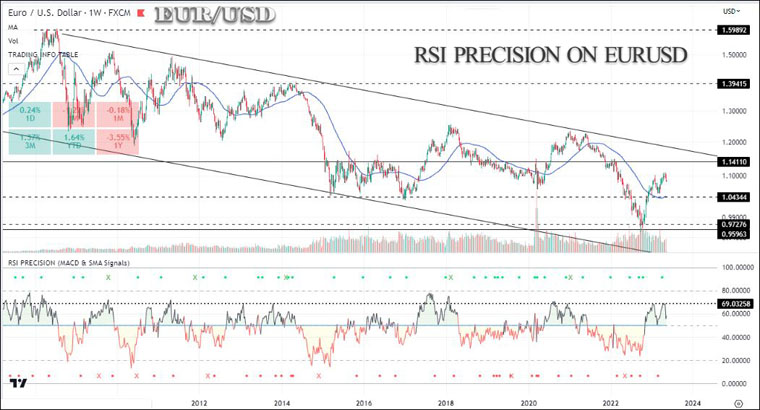
In the following chart, RSI Precision+ is applied on EURUSD.
Chart: RSI Precision+ on EURUSD

Here is a list of all the trading signals you can get by applying the indicator to any chart.
MACD CROSSOVERS
The signals correspond to the green dots (•) found on the top, and red dots found on the bottom.
(a) Bullish signal
- Event: MACD crosses above its signal line
- Symbol: Green Dot (•) on the Top
(b) Bearish signal
- Event: MACD crosses below its signal line
- Symbol: Red Dot (•) on the Bottom
NOTE: To avoid receiving too many signals in lower timeframes, you can switch off the MACD algorithm. Click on ‘SETTINGS’, then ‘STYLE’, and then unselect ‘Bullish MACD Cross’ and ‘Bearish MACD Cross’.
SMA CROSSOVERS
The signals correspond to the letter (X) found on the top and bottom of the indicator.
By default, the signals are generated by crossovers between SMA(50) and SMA(200). These are known as “Golden Cross” and “Death Cross” signals.
(a) Bullish signal
- Event: SMA(50) crosses above the slow SMA
- Symbol: Green (X) on the Top
(b) Bearish signal
- Event: SMA(50) crosses below SMA(200)
- Symbol: Red (X) on the Bottom
NOTE: You can adjust both SMA periods (Settings).
RSI PRECISION CROSSOVERS
The signals correspond to the green arrows (▲▼) found on the top, and red dots found on the bottom.
(a) Bullish signal
- Event: RSI Precision crosses above reading 5
- Symbol: Green arrow (▲) on the Bottom of the indicator
(b) Bearish signal
- Event: The RSI Precision crosses below reading 100
- Symbol: Red arrow (▼) on the Top of the indicator
RSI PRECISION OBJECTIVES
(i) spot overbought/oversold market levels (like the classic RSI)
(ii) get precise readings near market tops and bottoms (the momentum algorithm is very sensitive to booming volatility)
(iii) get precise readings on longer time frames, where the classic RSI readings are not precise
(iv) receive 3 different types of trading signals (RSI, SMA, MACD)
 RSI PRECISION BASIC SETTINGS
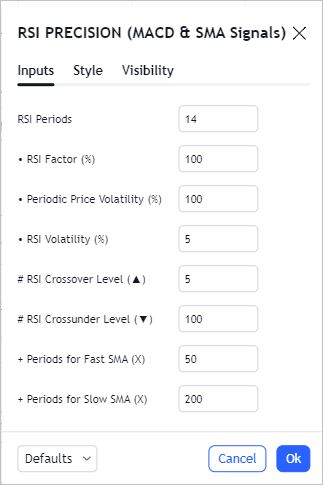
You can customize the entire formula of RSI Precision+ via 'Settings', where you will find a great variety of trading parameters.
- RSI PERIODS: Default is 14 periods
- RSI PRECISION FORMULA
(i) RSI FACTOR
(ii) PERIODIC PRICE VOLATILITY
(iii) RSI VOLATILITY (%): By default, 5%
- RSI CROSSOVER/CROSSUNDER LEVELS
- PERIODS FOR SMA CROSSOVERS
■ RSI PRECISION+: Use it here for free on TradingView:
» https://www.tradingview.com/script/kBpWBCXU-RSI-PRECISION-MACD-SMA-Signals/
□ RSI Precision Indicator (+ MACD & SMA Signals)
Developed by Giorgos Protonotarios, March 2022
![]() READ MORE ON FOREX AUTOMATIC
READ MORE ON FOREX AUTOMATIC


